Pulses
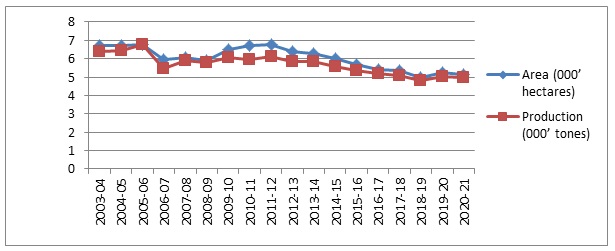
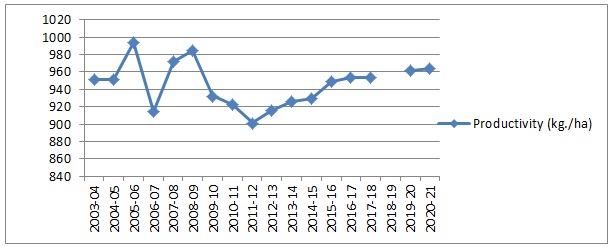
Area, Production and Productivity of Pulses in Sikkim.
| |
Year |
Area (000’ hectares) |
Production (000’ tones) |
Productivity (kg./ha) |
| 1. |
2003-2004 |
6.71 |
6.38 |
950.82 |
| 2. |
2004-2005 |
6.71 |
6.44 |
950.82 |
| 3. |
2005-2006 |
6.80 |
6.76 |
994.12 |
| 4. |
2006-2007 |
5.96 |
5.45 |
914.44 |
| 5. |
2007-2008 |
6.06 |
5.89 |
971.95 |
| 6. |
2008-2009 |
5.88 |
5.79 |
984.69 |
| 7. |
2009-2010 |
6.50 |
6.06 |
932.31 |
| 8. |
2010-2011 |
6.70 |
5.97 |
922.30 |
| 9. |
2011-2012 |
6.78 |
6.11 |
901.18 |
| 10. |
2012-2013 |
6.37 |
5.83 |
915.23 |
| 11. |
2013-2014 |
6.30 |
5.83 |
926.03 |
| 12. |
2014-2015 |
6.02 |
5.60 |
929.79 |
| 13. |
2015-2016 |
5.67 |
5.38 |
948.85 |
| 14. |
2016-2017 |
5.43 |
5.18 |
953.22 |
| 15. |
2017-2018 |
5.35 |
5.10 |
954.21 |
| 16. |
2018-2019 |
5.00 |
4.81 |
960.88 |
| 17. |
2019-2020 |
5.24 |
5.04 |
961.76 |
| 18. |
2020-2021 |
5.14 |
4.95 |
963.81 |


Source: Annual Reports, Food Security & Agriculture Development Department, Government of Sikkim